15 years data
We've taken a look back through 15 years of data to pick out some facts and trends.
Complaints received
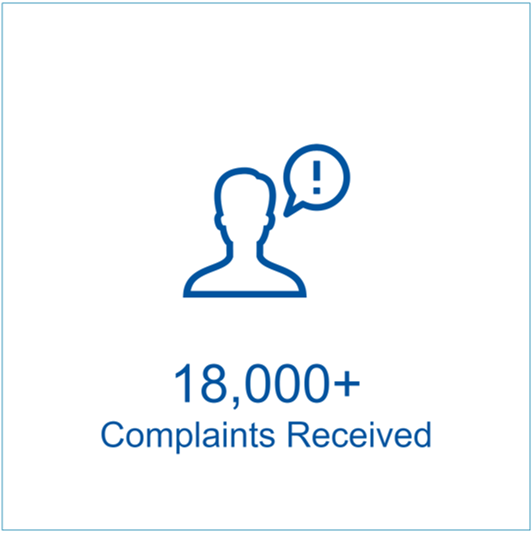
We have received over 18,000 complaints about lawyers and firms since we opened.
Top 5 areas of legal work
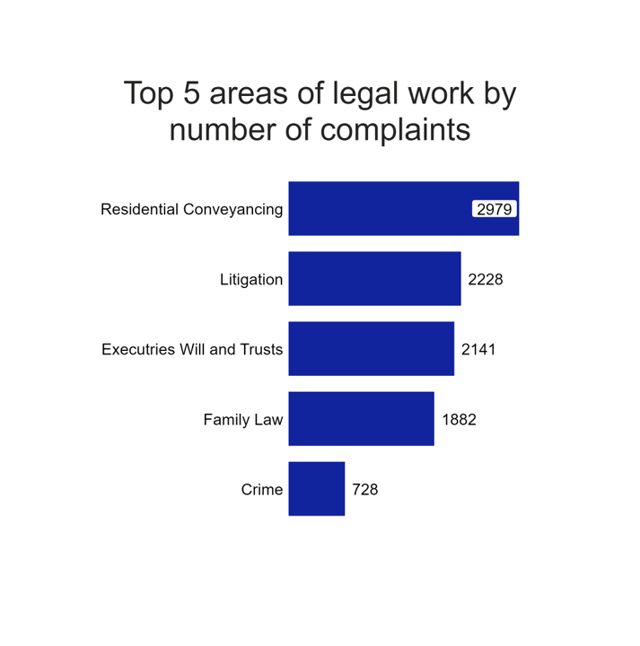
These are the top 5 areas of legal work by the number of complaints we received.
Area of legal work |
Number of complaints |
|---|---|
Residential conveyancing* |
2979 |
Litigation |
2228 |
Executries, wills and trusts |
2141 |
Family law |
1882 |
Crime |
728 |
*buying and selling a home
Mediations held
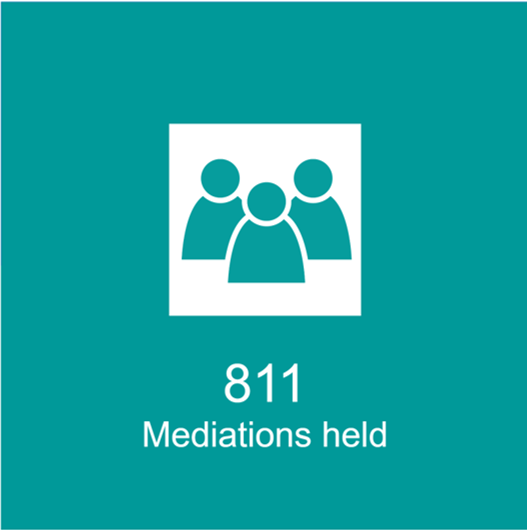
We held over 811 mediations.
Investigation reports
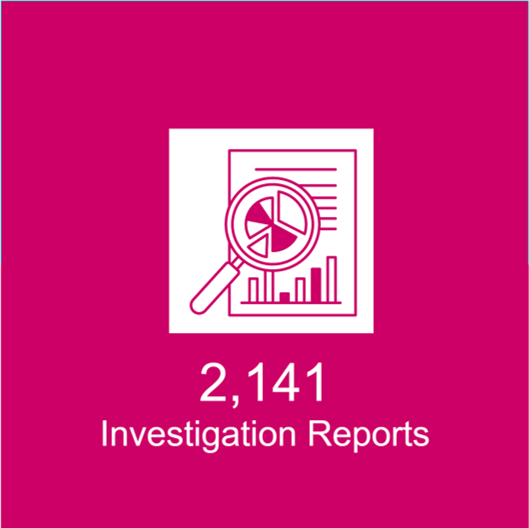
We issued over 2,141 investigation reports.
Determined complaints outcome
If a complaint is one of the small number not resolved during our process, our board members make a final determination on the complaint.
The data in this chart and table go back to 01/07/2014.
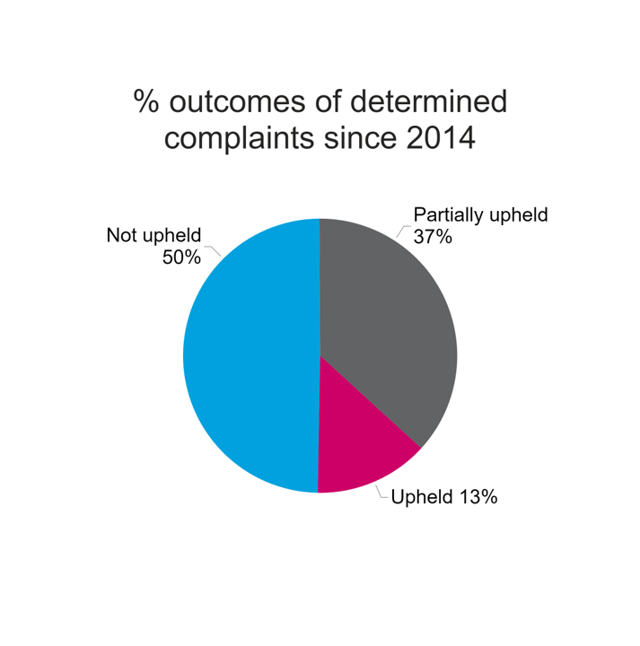
Outcome |
% of determinations |
|---|---|
Upheld |
13% |
Partially upheld |
37% |
Not upheld |
50% |
Compensation by year since 2014
If a complaint is settled at investigation or upheld at determination, we can recommend or order compensation.
The data in this chart and table go back to 01/07/2014.
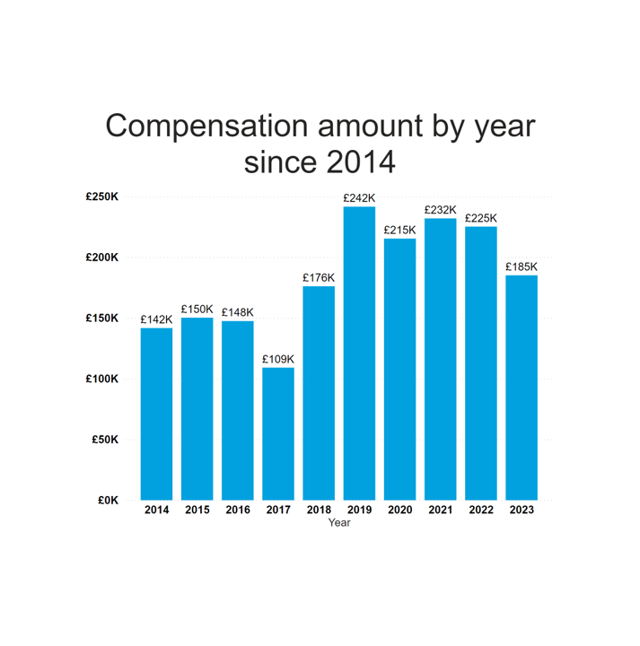
Year |
Compensation |
|---|---|
2014 |
£141,733.59 |
2015 |
£150,261.66 |
2016 |
£147,505.47 |
2017 |
£109,155.00 |
2018 |
£176,138.88 |
2019 |
£241,690.20 |
2020 |
£215,395.18 |
2021 |
£232,031.88 |
2022 |
£225,269.88 |
2023 |
£185,176.25 |
Average and median complaint duration by year
This chart and table show the average a median times complaints took from when the complaint form was received, to when the complaint was closed.
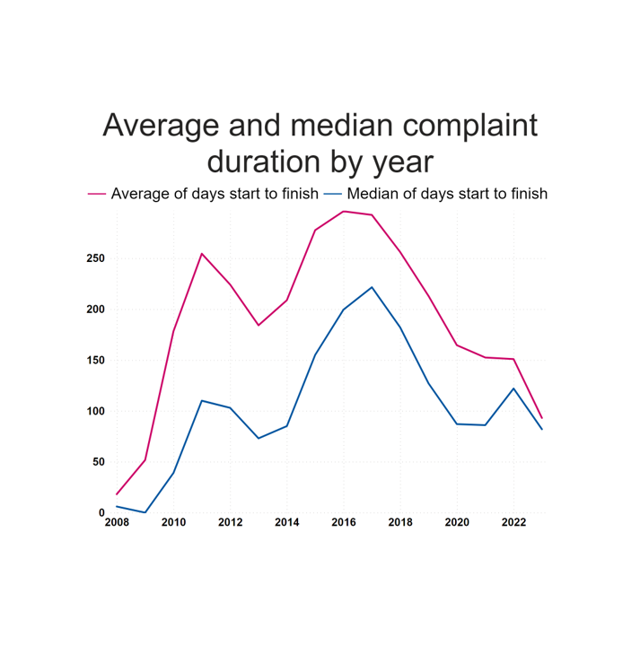
Year |
Average number of days |
Median number of days |
|---|---|---|
2008 |
18 |
6 |
2009 |
52 |
0 |
2010 |
178 |
39 |
2011 |
254 |
110 |
2012 |
224 |
103 |
2013 |
184 |
73 |
2014 |
209 |
85 |
2015 |
278 |
155 |
2016 |
296 |
200 |
2017 |
293 |
222 |
2018 |
256 |
182 |
2019 |
213 |
127 |
2020 |
165 |
87 |
2021 |
52 |
86 |
2022 |
151 |
122 |
2023 |
94 |
82 |
Trends in number of complaints per firm
52% of firms that were complained about to the SLCC received 1-4 complaints. Complaints to these firms included 10% of all complaints.
1% of firms that were complained about to the SLCC received 100 or more complaints. Complaints to these firms included 14% of all complaints.